I Scored My Discipline on Every Trade for a Year. It Mattered More Than My Strategy.
A one-year experiment: I scored discipline on all 72 of my trades and plotted it against outcome. Disciplined trades clustered in the winners; my rule-breaks were the leak. Here's the method — and how to run it yourself.
Sahil
For one year, I gave every single trade I took a discipline score — a 0–100 number for how well I followed my own rules on that trade — and plotted it against the result. Not P&L. Not whether I was right about the market. Just: did I follow my plan, and what happened?
72 trades later, the chart told me something I'd spent years refusing to believe: my discipline, not my strategy, decided my year. The disciplined trades clustered in the winners. The rule-breaks clustered in the losers. Same markets. Same trader. The only variable that moved was me.
Here's the experiment, what it showed, and exactly how you can run it on your own trades.
What is a discipline score in trading?
A discipline score is a number — I used 0 to 100 — that measures how closely a single trade followed your own pre-defined rules, independent of whether it made money.
It answers a different question than your P&L. P&L asks "did this trade win?" A discipline score asks "did I deserve to win?" Those are not the same thing, and conflating them is why most traders never improve.
I scored each trade across five pillars:
- Setup — did I have a stop and a target defined before entry?
- Entry — did I enter near my planned price, at my planned size?
- Management — did any changes I made have a written reason?
- Exit — did I exit for the reason in my plan, not on emotion?
- Review — did I tag the outcome and journal the trade afterward?
A trade that nails all five scores high. A trade where I moved my stop "just this once" and didn't journal it scores low — even if it made money.
The experiment: plotting discipline against outcome
The setup was simple. Two axes:
- X-axis: discipline score (0–100) for each trade.
- Y-axis: outcome in R-multiples (how many units of risk I made or lost).
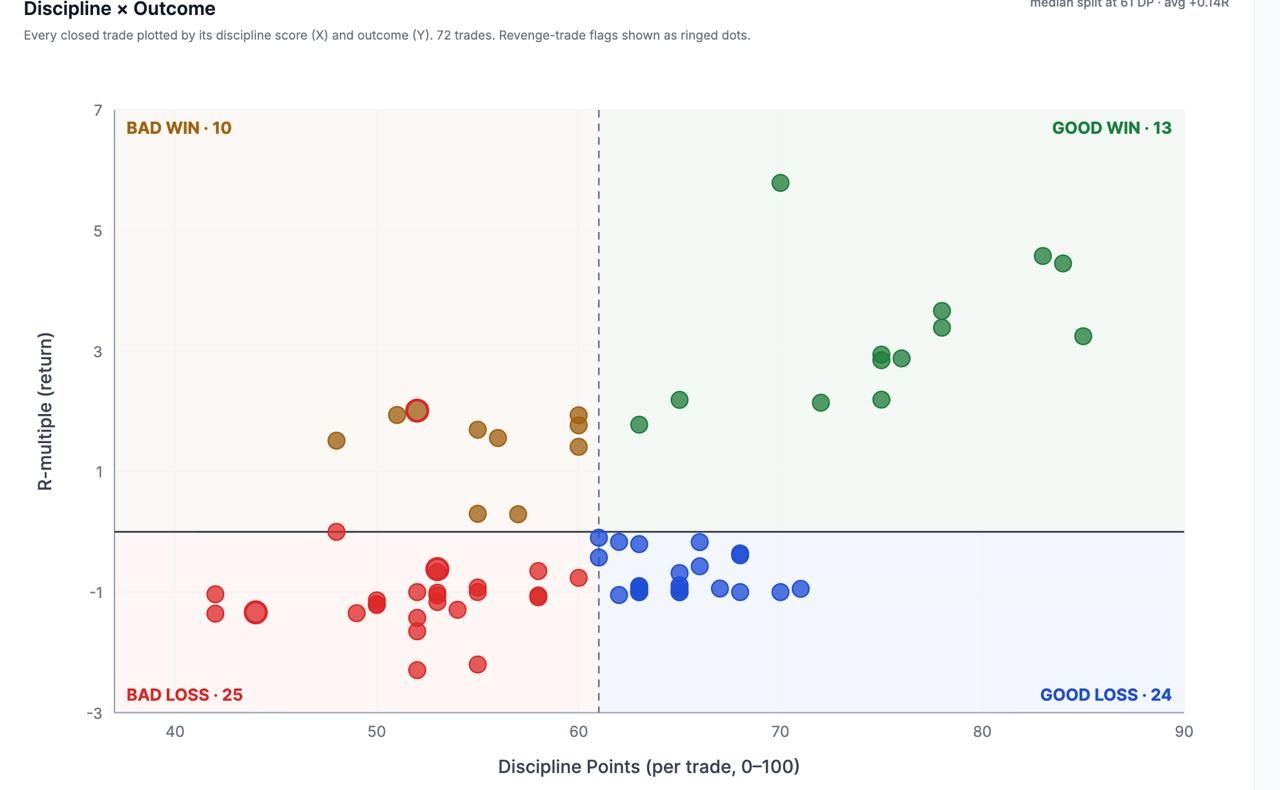
Every trade becomes one dot. Drop a line at your median discipline score and another at break-even, and the chart splits into four quadrants — the same Good/Bad × Win/Loss lens disciplined desks have used for years:
- Good Win — high discipline, made money. Repeatable.
- Bad Win — low discipline, got lucky. You'll give it back.
- Good Loss — high discipline, market just didn't cooperate. The cost of doing business.
- Bad Loss — low discipline, lost money and broke your rules. The one to fix.
The point of the quadrant is that it ignores luck. A Bad Win and a Good Loss look identical on your P&L statement — one's green, one's red — but they're telling you opposite things about your process.
What 72 trades revealed
When I plotted my year, the dots didn't scatter randomly. They sloped. The higher my discipline score on a trade, the better the outcome tended to be. My winners lived on the right (high discipline); my worst losses lived on the bottom-left (low discipline).
The breakdown:
- My disciplined trades — the ones where I followed my plan — were net positive.
- My rule-breaking trades were a net drag, and they were where almost all my real damage came from.
- The trades I felt best about in the moment — the impulsive Bad Wins — were the ones quietly setting up future losses.
I had always assumed my problem was strategy: the wrong setups, the wrong indicators, the wrong timeframe. The chart said otherwise. My setups were fine. My adherence was the leak.
The number that changed how I trade
Here's the one that stuck with me. When I separated the year into "followed my plan" versus "broke my rules," the disciplined half carried me and the undisciplined half bled me out. Run the counterfactual — if I'd simply turned my rule-breaking trades into disciplined ones — and my year would have been roughly 3× more profitable.
Same edge. Same strategy. Just discipline.
(One trader's own results — mine. Not typical, not a promise of returns, and not financial advice. The point isn't the multiple; it's that the lever was process, not prediction.)
How to run this experiment on your own trades
You don't need anything fancy. You need a structured log and the honesty to score yourself.
- Log every trade with the fields that let you score it: symbol, direction, planned entry, stop, target, size, exit reason, and an emotion tag.
- Score discipline 0–100 on the five pillars above. Be strict — a profitable trade where you broke a rule is still a low-discipline trade.
- Record the outcome in R, not just rupees, so big and small trades compare fairly.
- Plot discipline (x) against R-multiple (y) and split into the four quadrants.
- Read the pattern, not the dots. Where do your winners live? Where do your worst losses live? What % of your trades are Bad Losses?
- Fix one thing. Pick the single rule that, if you'd held it, would have moved the most dots out of the bottom-left.
If you want to skip the spreadsheet grind, this is exactly what A Trader's AI Toolkit automates — a ready-made tracker plus 10 copy-paste AI prompts that score each trade on the five pillars and build this quadrant for you. And TradrisAI does it automatically on every trade, with no copy-paste at all.
Not sure where you stand before you start? The free trading readiness assessment scores you across five dimensions in three minutes.
Why this matters more than another strategy
Most traders respond to a losing month by hunting for a new strategy. But you can't fix an adherence problem with a new setup — you'll just break the new rules the same way you broke the old ones. This is the slow leak behind behavior drift: your actual behavior separating from your intended behavior, one small decision at a time.
Scoring discipline makes the invisible visible. Once you can see that your Bad Losses are clustered and expensive, you stop arguing with yourself about whether you're disciplined. The chart already answered it.
Frequently asked questions
What is a discipline score in trading? A discipline score is a 0–100 measure of how well a single trade followed your pre-defined rules — setup, entry, management, exit, and review — regardless of whether it made money. It separates process quality from luck.
How do you measure trading discipline? Score each trade against a fixed checklist (a stop and target set before entry, entry near plan, changes made for written reasons, exit per plan, outcome journaled), then track that score over time and against your results.
Does discipline actually improve trading returns? In my own one-year sample, disciplined trades were net positive and rule-breaking trades were the main source of loss. Discipline doesn't guarantee profit, but plotting it against outcome reliably exposes where your money is leaking. Individual results vary; this is educational, not financial advice.
What's the difference between a "good win" and a "bad win"? A Good Win followed your plan and made money — it's repeatable. A Bad Win broke your plan and got lucky — it's not, and over enough trades you tend to give those gains back.
Want the tracker and the 10 AI prompts I used to score every trade? Grab A Trader's AI Toolkit, or start free on TradrisAI to have your discipline scored automatically on every trade.